
Markets Move in Rhythm
Get the Tools to Decode it

Trading Cycle Analysis Indicators |
Built in Easylanguage for Tradestation

🎉 Launch Sale: 40% off everything — solo indicators, bundles, and your first billing cycle on any subscription.
👉 Use promo code LAUNCH_SALE at check-out

What is Phaztech?

Most indicators use a fixed lookback, the same number of bars no matter what the market is doing. When market cycles speed up or slow down, those fixed settings produce whipsaws and late signals.

Phaztech indicators measure the cycles that are actually driving price, and adapt as those cycles change length. They’re built on three published methods:

  • Hurst Cycle Theory: shows where price actually is in its cycle
  • Digital Signal Processing: adapts as the cycle itself changes length
  • Goertzel + Bartels confirmation: verifies a cycle is real before it’s used to call a turning point

All 9 indicators run natively inside TradeStation, alongside the tools you already use.

Runs on Tradestation
Use Indicators Separately or More Powerfully in Combination
Subscription Offers

Try out the whole ensemble and pay a monthly fee

Fully Customizable

Analyze the Cycles and Anticipate the Moves

Custom designed Indicators that run on Tradestation, giving you the power of a full cyclic analysis suite

The Power of Spectral Analysis

spec analysis rank 2

Spectral Analysis

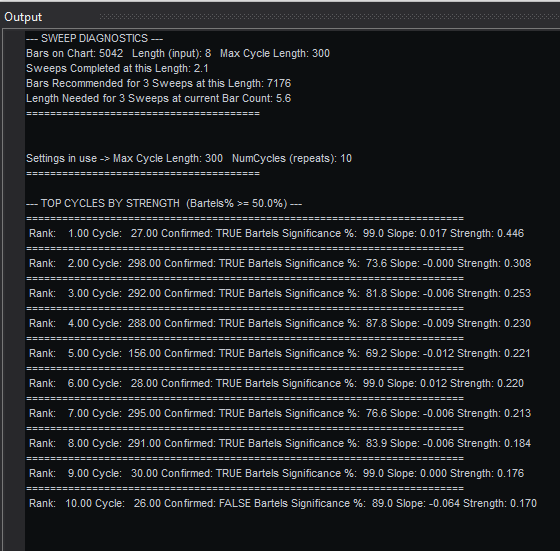
Detect only the Cycles that are stable and recurring enough to be significant and their associated power to move price
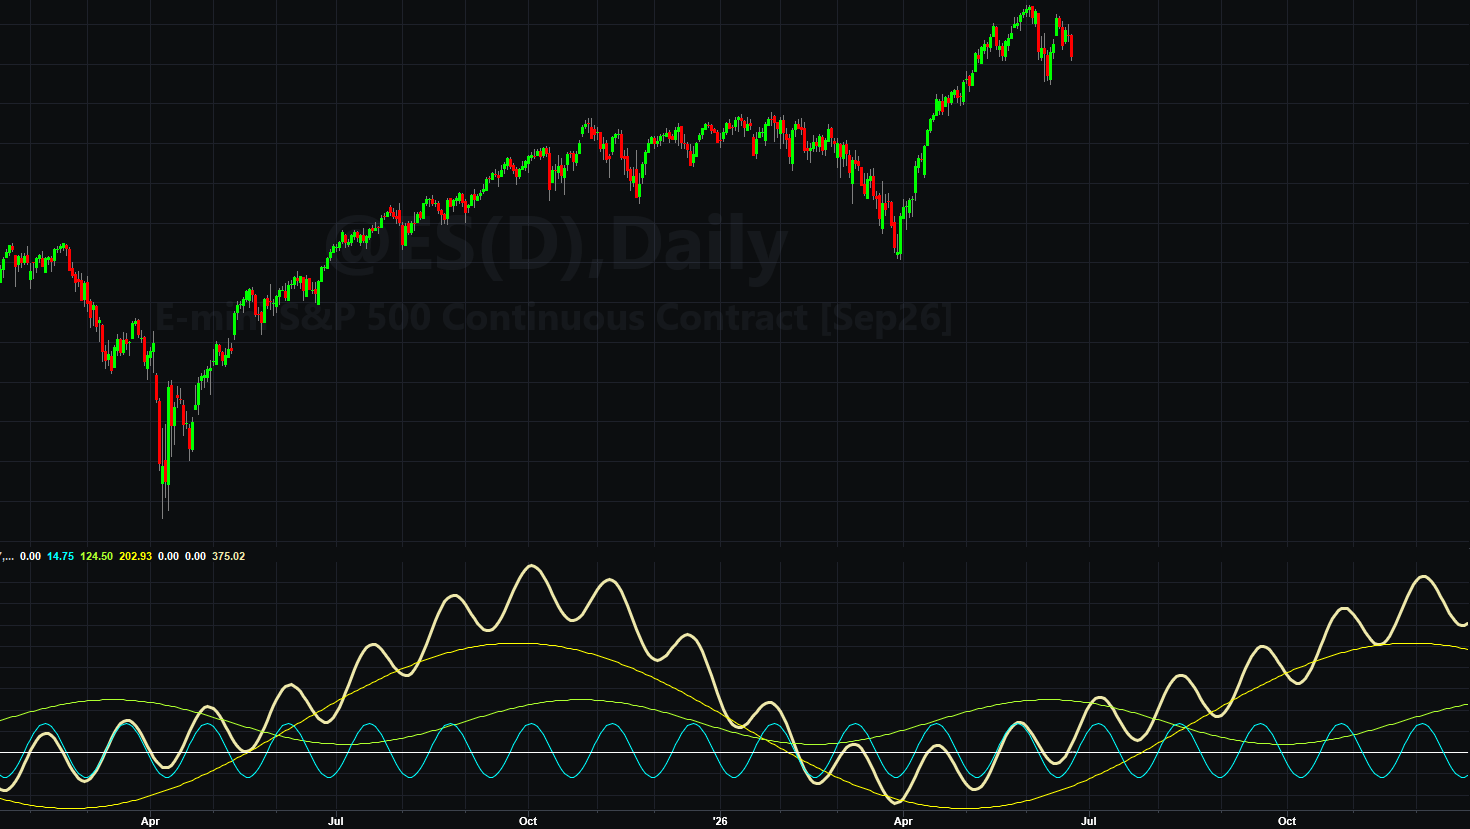
Spectral Analysis Viewer confirming detected market cycles visually

Spectral Analysis Viewer

Visually confirm the cycles you find with the paired viewer

Spectral Analysis subgraph plotting cycle strength and stability over time

Graph the Results

Indicator graphs in a subgraph both which cycles are moving price and which cycles are stable in the data

Gaining an Edge Through Visualizing Market Harmonics